
Beyond Real-world Benchmark Datasets: An Empirical Study of Node Classification with GNNs
Published:
Summary:
Due to limited graph datasets, the comprehensive study of GNNs has been restricted. Further, the effect of different properties of the graphs on the effectiveness of GNNs has yet to be explored. There are graph generators like SBM, but the quality and variety of the graphs generated are limited and do not support generating node attributes. Hence a fine-grained study of graph characteristics is not possible. This work uses GenCAT graph generator to generate various graphs by varying the characteristics and does an empirical study of the performance of GNNs on these graphs. There are some existing works on benchmarking and surveys of GNNs. The benchmark works are not as extensive as this one because of limited graphs. Also, all the different graph characteristics mentioned below have not been used. GraphWorld is one such paper which does not consider heterophily, class size distribution and efficiency much. There has been a survey classifying GNNs into different categories, and most surveys are just to summarise the research done and hence do not contain any experimental results. Main Contributions: The main contributions of the paper are to analyse the effect of the following graph characteristics on the performance of GNNs through extensive experimentation:
- class size distributions
- the relationship between classes and topology
- the relationship between classes and attributes
- graph sizes
Specific Comments:
- The evaluation is done on a large set of GNN models and a wide range of values for each of the above characteristics. Thus the evaluation is exhaustive.
- Evaluation of both macro-f1 score and accuracy has been done.
- In the graph size evaluation, the number of nodes and edges seems quite small. As there are much larger real-world graphs out there.
- Another similarity characteristic between train and test set distribution should have been considered.
- The evaluation has been done on the node classification task. Other tasks need to be analysed as well.
- Only Homogenous graphs have been considered.
- Similar performance analysis of pre and post-processing techniques must also be done.
Detailed Analysis of the Solution Approach:
For the comprehensive fine-grained analysis, the graph generator needed to have the following two characteristics:
- Generating graphs in which nodes are associated with attributes and labels
- Flexible controlling the characteristics of generated graphs Graph generators like FastSGG, SBM, eSBM were considered but fail to give flexibility in terms of one of the characteristics that need to be studied and hence were not taken. GenCAT gives flexibility in all the required characteristics and was finalised as a SOTA generator. GenCAT inputs several parameters called class features and graph features to capture various characteristics in attributed graphs. The following are the main features needed:
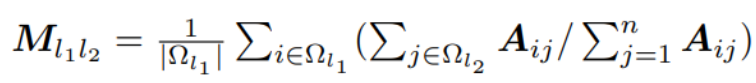
- Class features: a. Class size distribution: The number of nodes for a given class.(ρl = |Ωl| for each class l). b. Class preference mean: Given a pair of classes l1 and l2, the average number of edges from l1 to l2 nodes among all the nodes from l1 nodes. Thus how many class l1 nodes prefer class l2 nodes? This is an asymmetric relation.
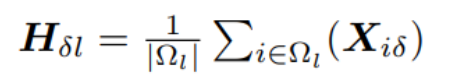
c. Attribute-class correlation: The degree to which the node’s attributes are related to its class.
- Class features: a. Class size distribution: The number of nodes for a given class.(ρl = |Ωl| for each class l). b. Class preference mean: Given a pair of classes l1 and l2, the average number of edges from l1 to l2 nodes among all the nodes from l1 nodes. Thus how many class l1 nodes prefer class l2 nodes? This is an asymmetric relation.
- Graph features: The fundamental statistics of graphs, such as the numbers of nodes, edges and attributes The above inputs are given to the generator, for generating graphs of various sizes.
Detailed Analysis of Validation and Experiments conducted:
The empirical studies focus on the four characteristics mentioned in the contributions section. A set of 16 GNNs and also MLP have been used in total. The authors use the Cora dataset to get baseline values for each feature described above and then vary these to do an exhaustive evaluation. Random class splits (60%/20%/20% of nodes for train/validation/test for each graph have been used. Grid search has been used to get the best hyperparameters. The primary metric is macro-f1 score to balance the fairness and accuracy of the predictions. Let us see the results for each characteristic: Various Class Size Distribution There is often a class imbalance in the datasets i.e. more examples of one class than another. The loss functions mainly optimize accuracy, so the model gives priority to the majority classes compared to the minority classes. The following formula has been used to generate different class distributions: 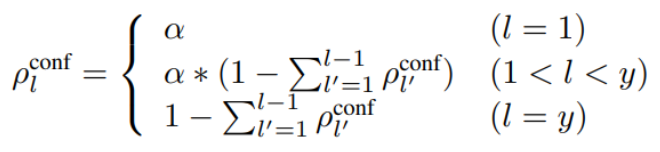
α is the largest class size. α ∈ [0.4, 0.5, 0.6, 0.7] values were considered. Also, this was compared to the balanced case where all classes occur equally. In the balanced setting, the very recent method GPRGNN achieves the best f1-macro due to its high expressive capability. On the other hand, interestingly, the simplest algorithm SGC outperforms other complicated GNN algorithms in imbalanced settings. Various Edge Connection Proportions between Classes The following formula was used to generate the different class preferences: 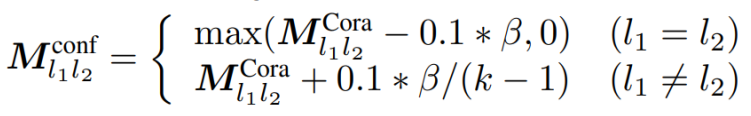
where β is a parameter controlling the homophily/heterophily property in a graph, and MCora indicates the class preference mean of Cora. A high β means more heterophily, and a low β means more homophily. β ∈ [0, 2, 4, 6, 8] were used. All models work well in the homophily setting. In heterophily, only GNNs that generalise well to These settings, like H2GCN, FSGNN, and GPRGNN, work well, while GCN and GAT do not. This indicates that graphs that generalise well to the heterophilic setting don’t use the graph topology much, especially for strong heterophily when β = 8. Finally, all models obtain low f1-macro scores when edges are almost randomly generated between classes(β = 6). Various Attribute Values The following formula was used to generate the attribute-class correlations:
Hconf = (HCora + γc)/(1 + γ)
If γ is large, the correlation is less i.e. attributes are less valuable to predict labels. γ ∈ [16, 4, 1, 0] values were used. Most models obtain low f1-macro scores when attribute values are close to random. SGC works well in some cases because it does not over-fit large classes due to the simplicity of its model. the very recent method GPRGNN, consistently performs well compared with other GNNs. Finally, MLP achieves a larger performance gain than most GNNs between the leftmost and rightmost points. This indicates some overlap between the contributions of the topology and attributes to node classification. This indicates some overlap between the contributions of the topology and attributes to node classification. Various graph sizes The following pairs of the numbers of nodes and edges (n, m) to [(3000, 5000),(6000, 10000),(9000, 15000),(12000, 20000),(15000, 25000)] were used for evaluation. Several GNNs obtain lower f1-macro scores when the graphs are larger. When we use accuracy as a metric, most GNNs achieve better scores as graphs grow. MLP increases its classification performance as graph sizes are large since it appropriately fits node attributes using more train data from larger graphs. The graphs for the above evaluations are given below: 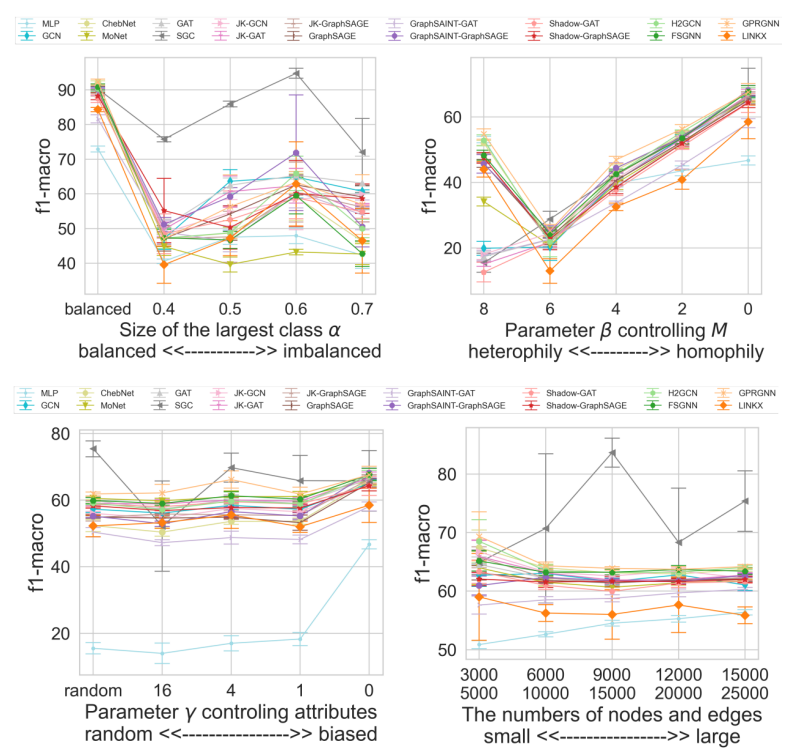
The authors also evaluated the training efficiency on synthetic graphs with various graph sizes. The general trend is that the time increases with size and density, and for some, it is significantly more because of more number of operations.
Further works:
From the above works, it is clear that work should be done to improve the performance in class imbalance and heterophily settings. Also, evaluations considering more characteristics like train-test distributions and feature similarity on larger graphs can be done to get a better insight.